Lab #2: Interpreting and Matching Displacement Versus Time Motion Graphs
Purpose:
The purpose of this lab is to gain competent understanding of the use of motion detectors and other related equipment and gain an understanding between position versus time graphs, velocity versus time graphs, and acceleration versus time graphs through the creation of one's own position versus time graph and the mapping of said graph using a motion detector.
Equipment:
- Motion Detector
- Meter stick
- Computer with LoggerPro installed
Procedure:
Part #1: Pre-Lab Preparations
First, create a position versus time story describing a body in motion that includes the following position versus time elements: standing still, moving with constant velocity, moving with a variable negative velocity, and moving with a variable positive velocity. Second, create a position versus time graph that illustrates the motion in the story. Create a legend for the graph that corresponds with elements in the story. Third, beneath the graph, provide instructions on how to recreate the shape of the graph by moving in front of a motion detector. Provide a scale with the instructions so that it can be checked.
Part #2: Recreating the Graph
First, measure out positions on the floor that are needed to recreate the position versus time graph and practice the motions. Second, use a Vernier motion detector, and using the marked out positions on the ground, attempt to recreate the graph. Once this is complete, input the data from the best graph on the labquest into LoggerPro to recreate the graph.
Part #1:
Story:
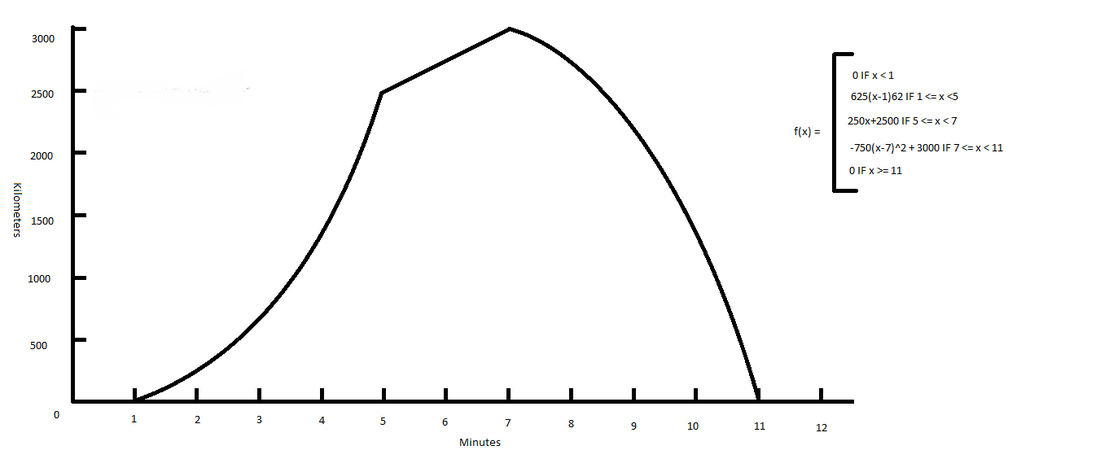
An antimatter-propelled rocket is put onto a launchpad at zero kilometers above the surface and stays at rest for one minute. At one minute elapsed time, the rocket launches, accelerating upwards for four minutes until it reaches 2500 kilometers above the surface at five minutes elapsed time, at which it stops accelerating. From five to seven minutes of elapsed time, the rocket maintains a constant velocity of 250 kilometers a minute in a sub-orbit, putting upward displacement during the time from 2500 kilometers to 3000 kilometers. At seven minutes elapsed time, the rocket initiates a de-orbit burn (which is redundant due to the rocket being in a sub-orbit, but these are no rocket scientists, so the illogical process is explained as such), causing it to decelerate from seven to eleven minutes elapsed time and reduce its vertical displacement from 3000 kilometers to zero kilometers, upon which the rocket impacts the ground and violently explodes.
Motion Instructions:
Here are instructions on how to move in front of a motion detector in order to obtain a graph of the same shape and scale. These instructions are based on a distance scale of 1000 kilometers to one meter on the x-axis, and one minute to one second on the t-axis.
1. Remain still for one second.
2. Accelerate away from the motion detector for four seconds to 2.5 meters away from the detector.
3. Maintain a constant velocity away from the motion detector for two seconds, reaching 3 meters away from the detector.
4. Accelerate twoards the motion detector, reaching zero meters in front of the detector in four seconds.
Part #2:
Collected Data:
Data Analysis:
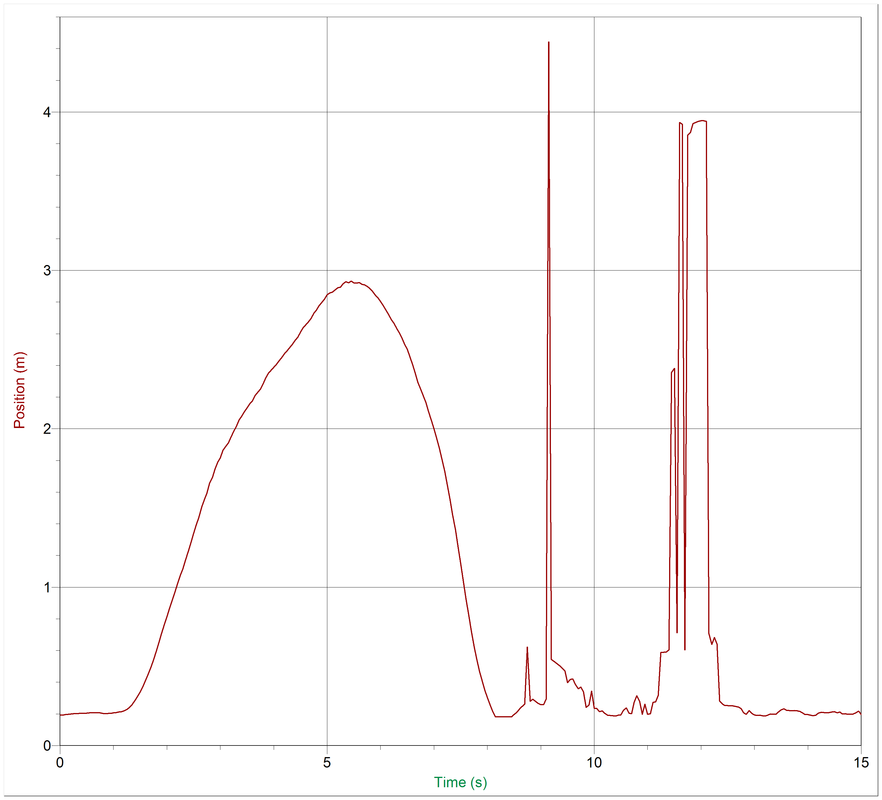
The most obvious difference between the graph of f(x) and the graph of the group's motion above would be the large fluctuations that occur after t=8. These were caused by the motion of a book that was put in front of the detector momentarily; since the main part of the graph describing the motion was not affected by this error, it was decided that this graph would be kept, as it is very accurate without the fluctuations after t=8. One other discontinuity between this graph and the graph of f(x) is the timing of the velocity and acceleration changes, as the time scale noted in the Motion Instructions section of the report does not match the above graph's scale. The actual scale for the graph above and the graph of f(x) would be approximately 1.3 minutes to one second. This error may have been caused by the lack of a proper timing device during the motion test, thus the difficulty to gauge when to switch to the next motion. There is also a position scale error, in which the true scale for the x-axis should be .98 kilometers to one meter. This error may have come from a slight misstep during the third motion. Other than these mentioned differences, the graph of f(x) is most accurately portrayed by the above graph.
Conclusion:
In conclusion, the graph created by the motion detector was made in order to most accurately match the graph of f(x), though some errors in the creation of the motion that was used to derive the graph led to inconsistencies between f(x) and the motion graph. These errors include inaccurate movement and timing during the motions to the misplacement of a book in front of the motion detector at the end of the motion graph. An understanding of motion detectors and their related equipment (the lab-quest in this instance) was gained through the creation of the position versus time plot, and the relationships between position, velocity, and acceleration versus time graphs were understood through the creation of a graph (f(x)) which contained four different elements of motion. With the motions in the graph being done in the lab, the motions of the graph could be observed in actual space and a better grasp of position versus time graphs could be reached.
